
Usage
The Client Statistics page shows usage information of all access to your Workspace or Repositories. It includes the next areas:
- Overview of usage
- Delivery Summary
- Package Delivery
- Artifact data
To access this feature, click on Usage on the top right corner of your Workspace/Repository Overview page.
Overview of usage
The total amount accumulated during the Current Billing Cycle for:
- Package Delivery.
- Artifact data.
- Packages.
- Container images.
- Open Source delivery.
When applicable, it also includes a comparative (percentage variation) with the previous comparable cycle.
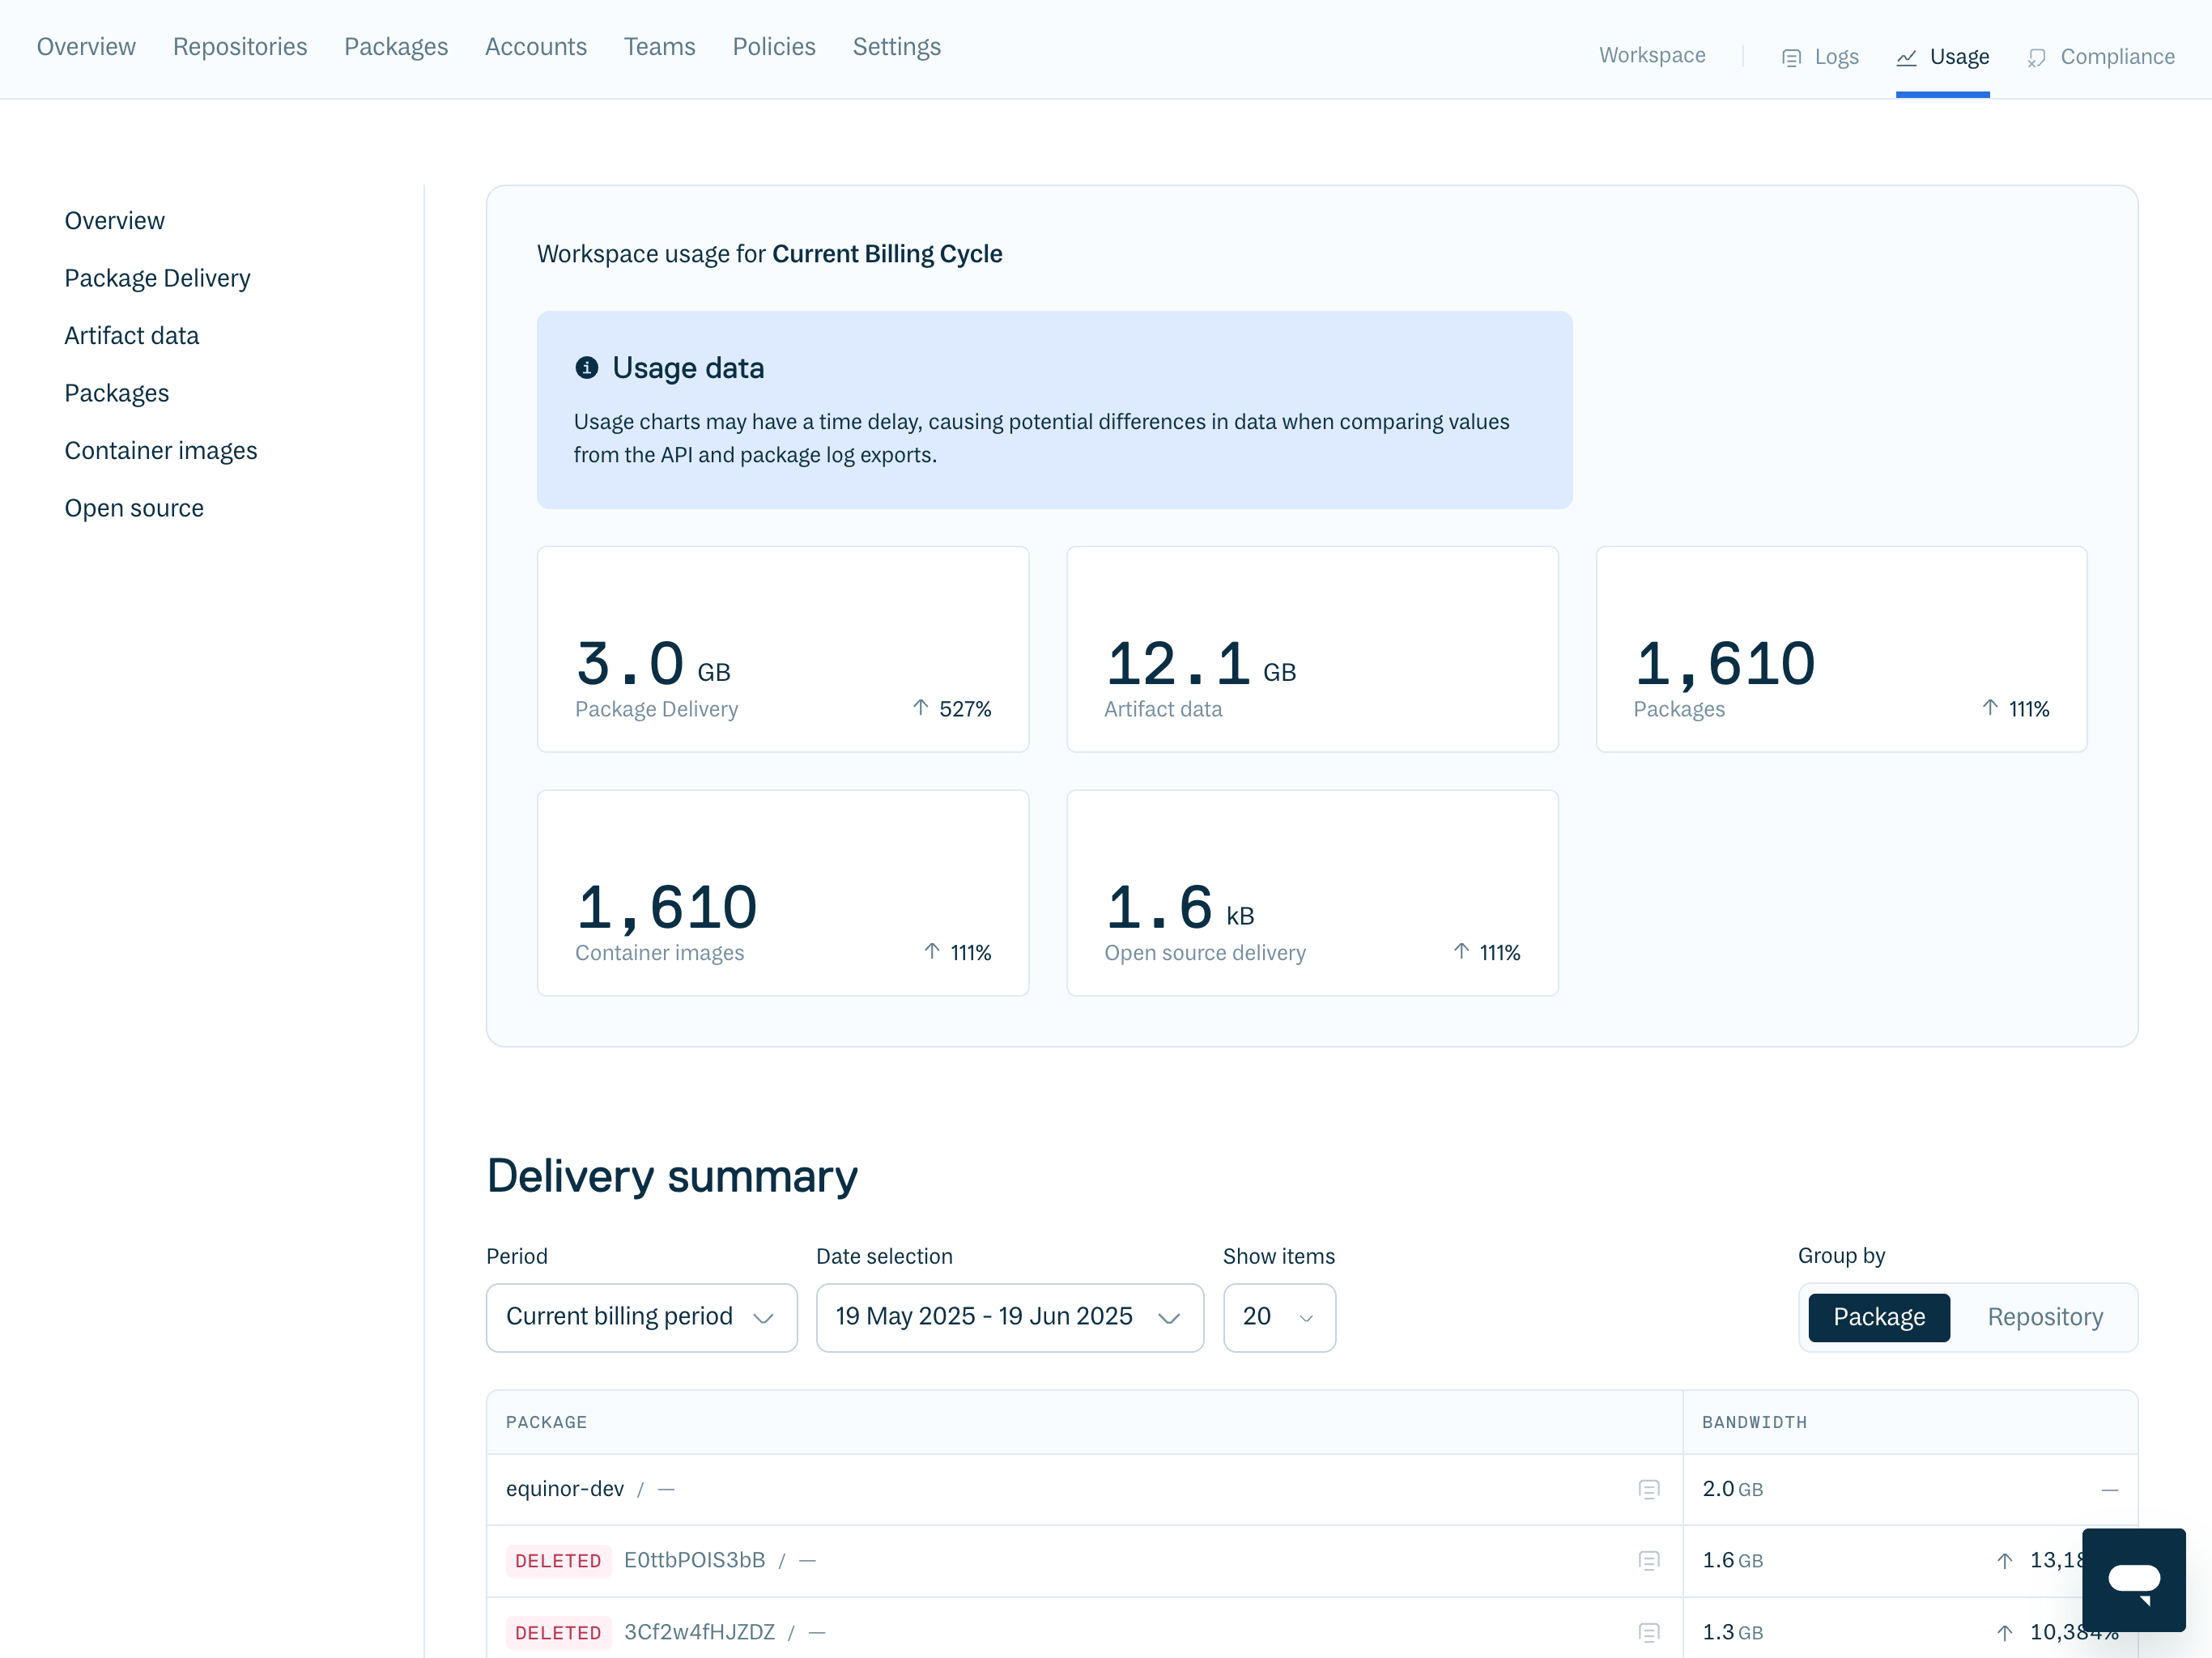
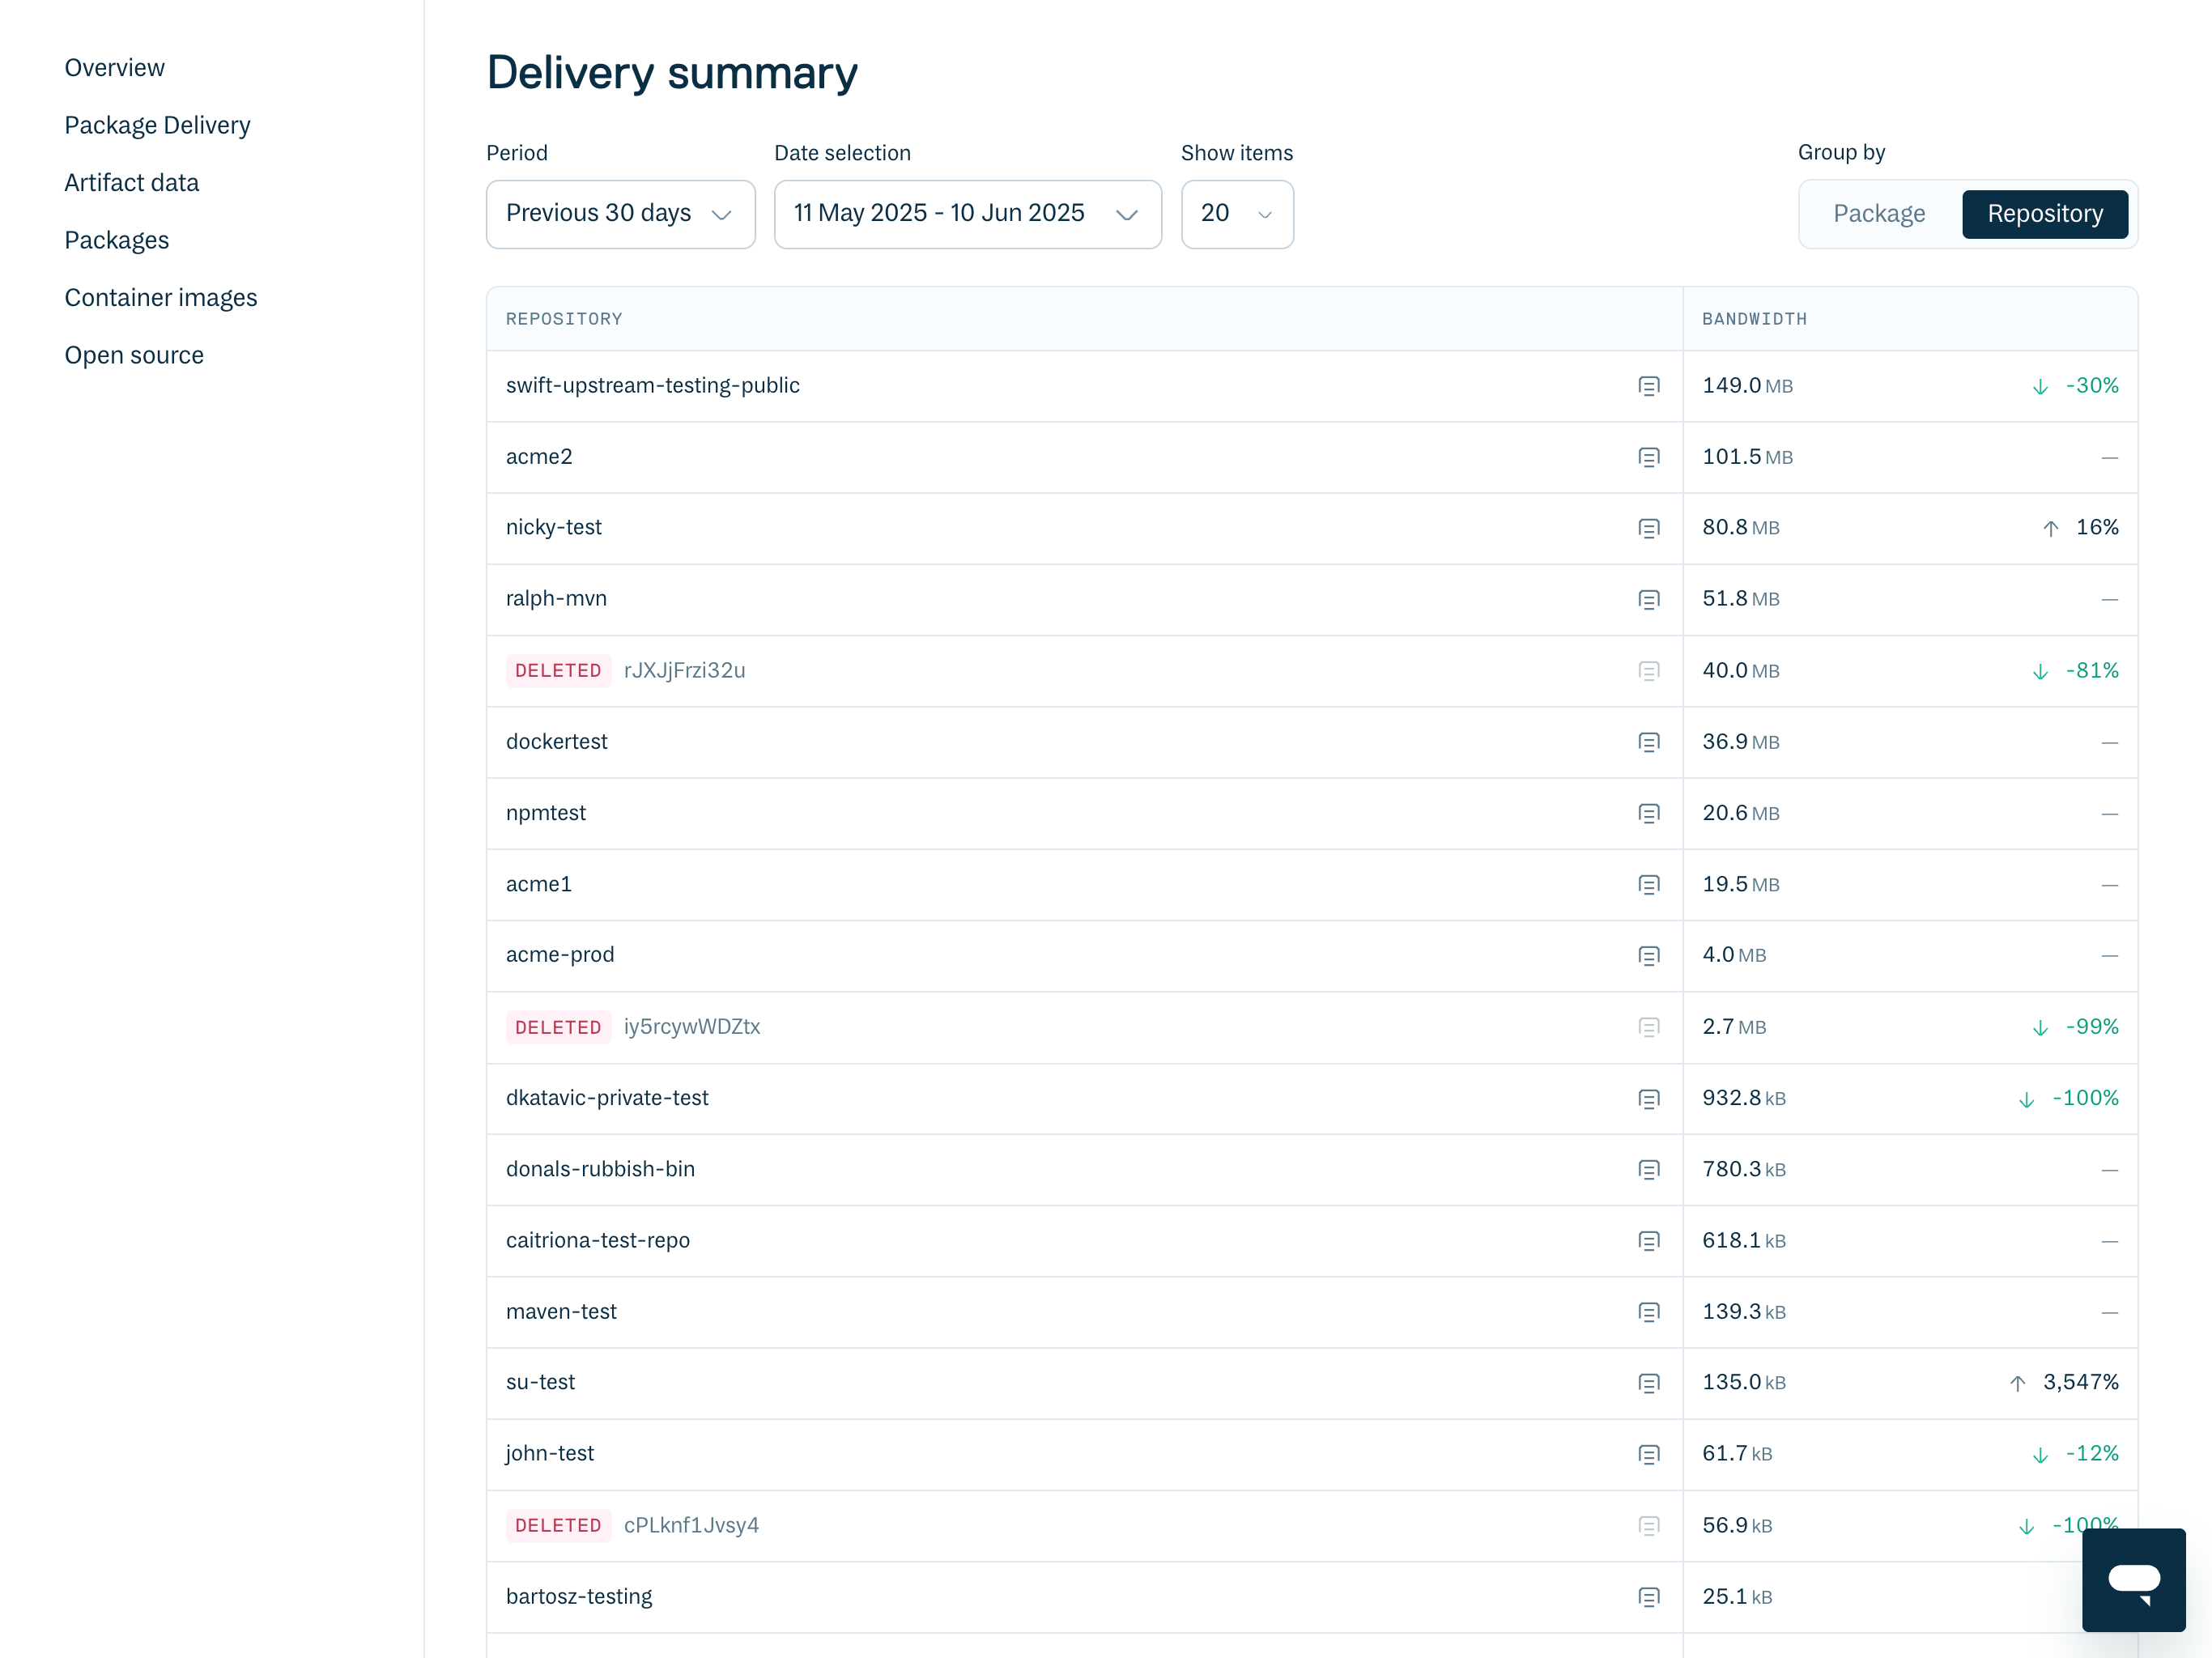
Delivery Summary
Displays a list of all of the package bandwidth for the selected time scope. The results can be grouped by package or repository, and display the trend compared with the previous comparable time scope.
All of the data available in this chart is sourced from the Client Logs feature.
Click on any of the entries in the list to view its own data in the Client Logs.
Package Delivery
The "Package Delivery" chart presents data related to package consumption, enabling monitoring and analysis of download trends over defined periods. It displays metrics such as total downloads and bytes transferred, contributing to an understanding of artifact distribution and utilization.
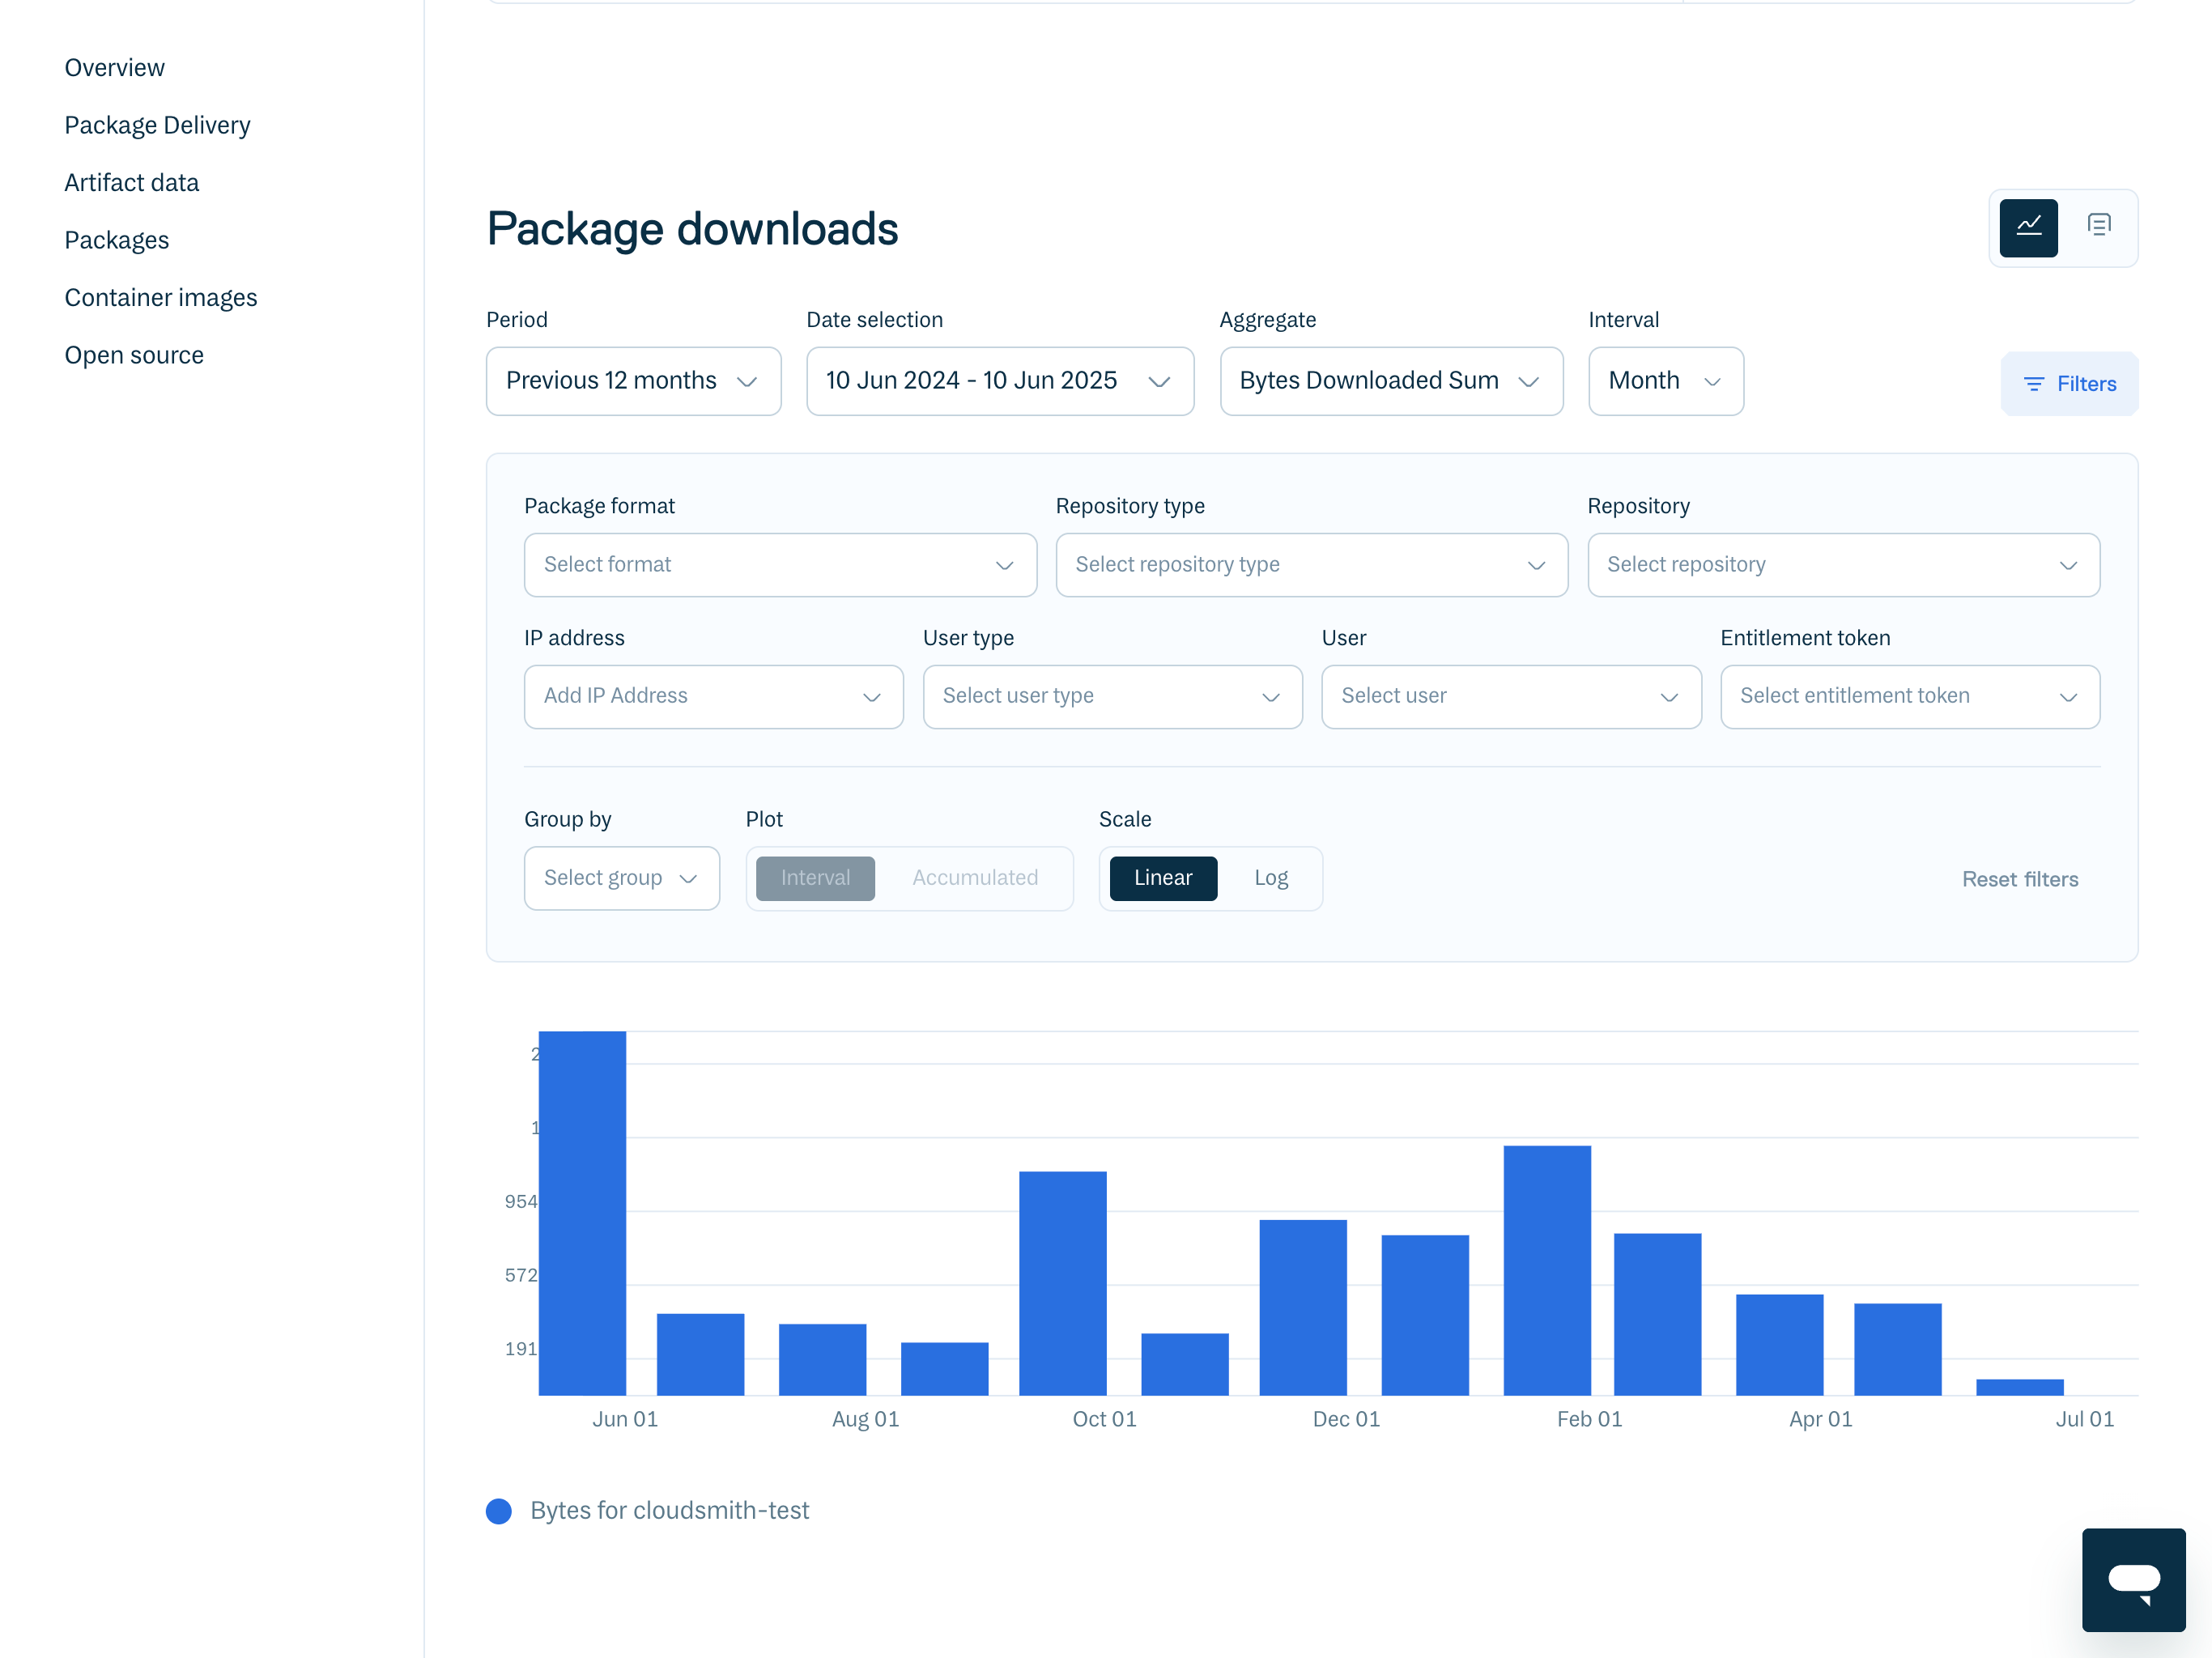
This section can be displayed as a chart or a table. In both cases, it displays the same information: package download activity. Users can select various aggregate types, including "Bytes Downloaded Sum" for data transfer volume, or other metrics like download counts.
Basically, aggregate allows you to decide how you want to quantify or summarize the package download activity. Here you can find a detailed list of options available:
- Bytes Downloaded Average.
- Bytes Downloaded Sum.
- Unique IP Address Count.
- Request Count.
- Time Taken (Avg, Max, P50, P75, P90, P95, P99, Sum).
Time Period Selection
- Period: Pre-configured options are available for historical data analysis (e.g., "Previous 12 months").
- Date Selection: A configurable date range picker (e.g., "10 Jun 2024 - 10 Jun 2025") allows for specific data window definition.
- Interval: Data can be viewed by different time intervals, such as "Month" or other available options. In order words, this is the bucket size for which the "Aggregate" calculation is performed.
Filtering Options
These filters allow you yo refine displayed data based on specific criteria:
-
Package format: Filters by package type (e.g., npm, Maven, Docker).
-
Repository type: Filters by repository classification (e.g., private, public).
-
Repository: Filters data for a specific repository.
-
IP address: Filters usage originating from specific IP addresses.
-
User type: Differentiates between user classifications.
-
User: Filters by individual user download activity.
-
Entitlement token: Filters usage associated with specific access tokens.
-
Other filters available for plot Configuration:
- Group by: Allows data aggregation based on selected criteria (e.g., package format, repository).
- Plot Type: Options include "Interval" (data per period) and "Accumulated" (cumulative data).
- Scale: Selection between "Linear" and "Log" scales for data display.
-
Reset Filters: A "Reset Filters" function is available to restore default filter settings.
Purpose
This chart serves to provide data for:
- Monitoring bandwidth consumption, and impact on billing.
- Identifying package download frequencies.
- Tracking user-specific download activities, although Client Logs might be better suited for this goal.
- Evaluating the impact of different repositories or package formats.
- Reviewing access patterns via entitlement tokens.
Artifact Data
Total amount of Artifact data stored within the Workspace/Repository.
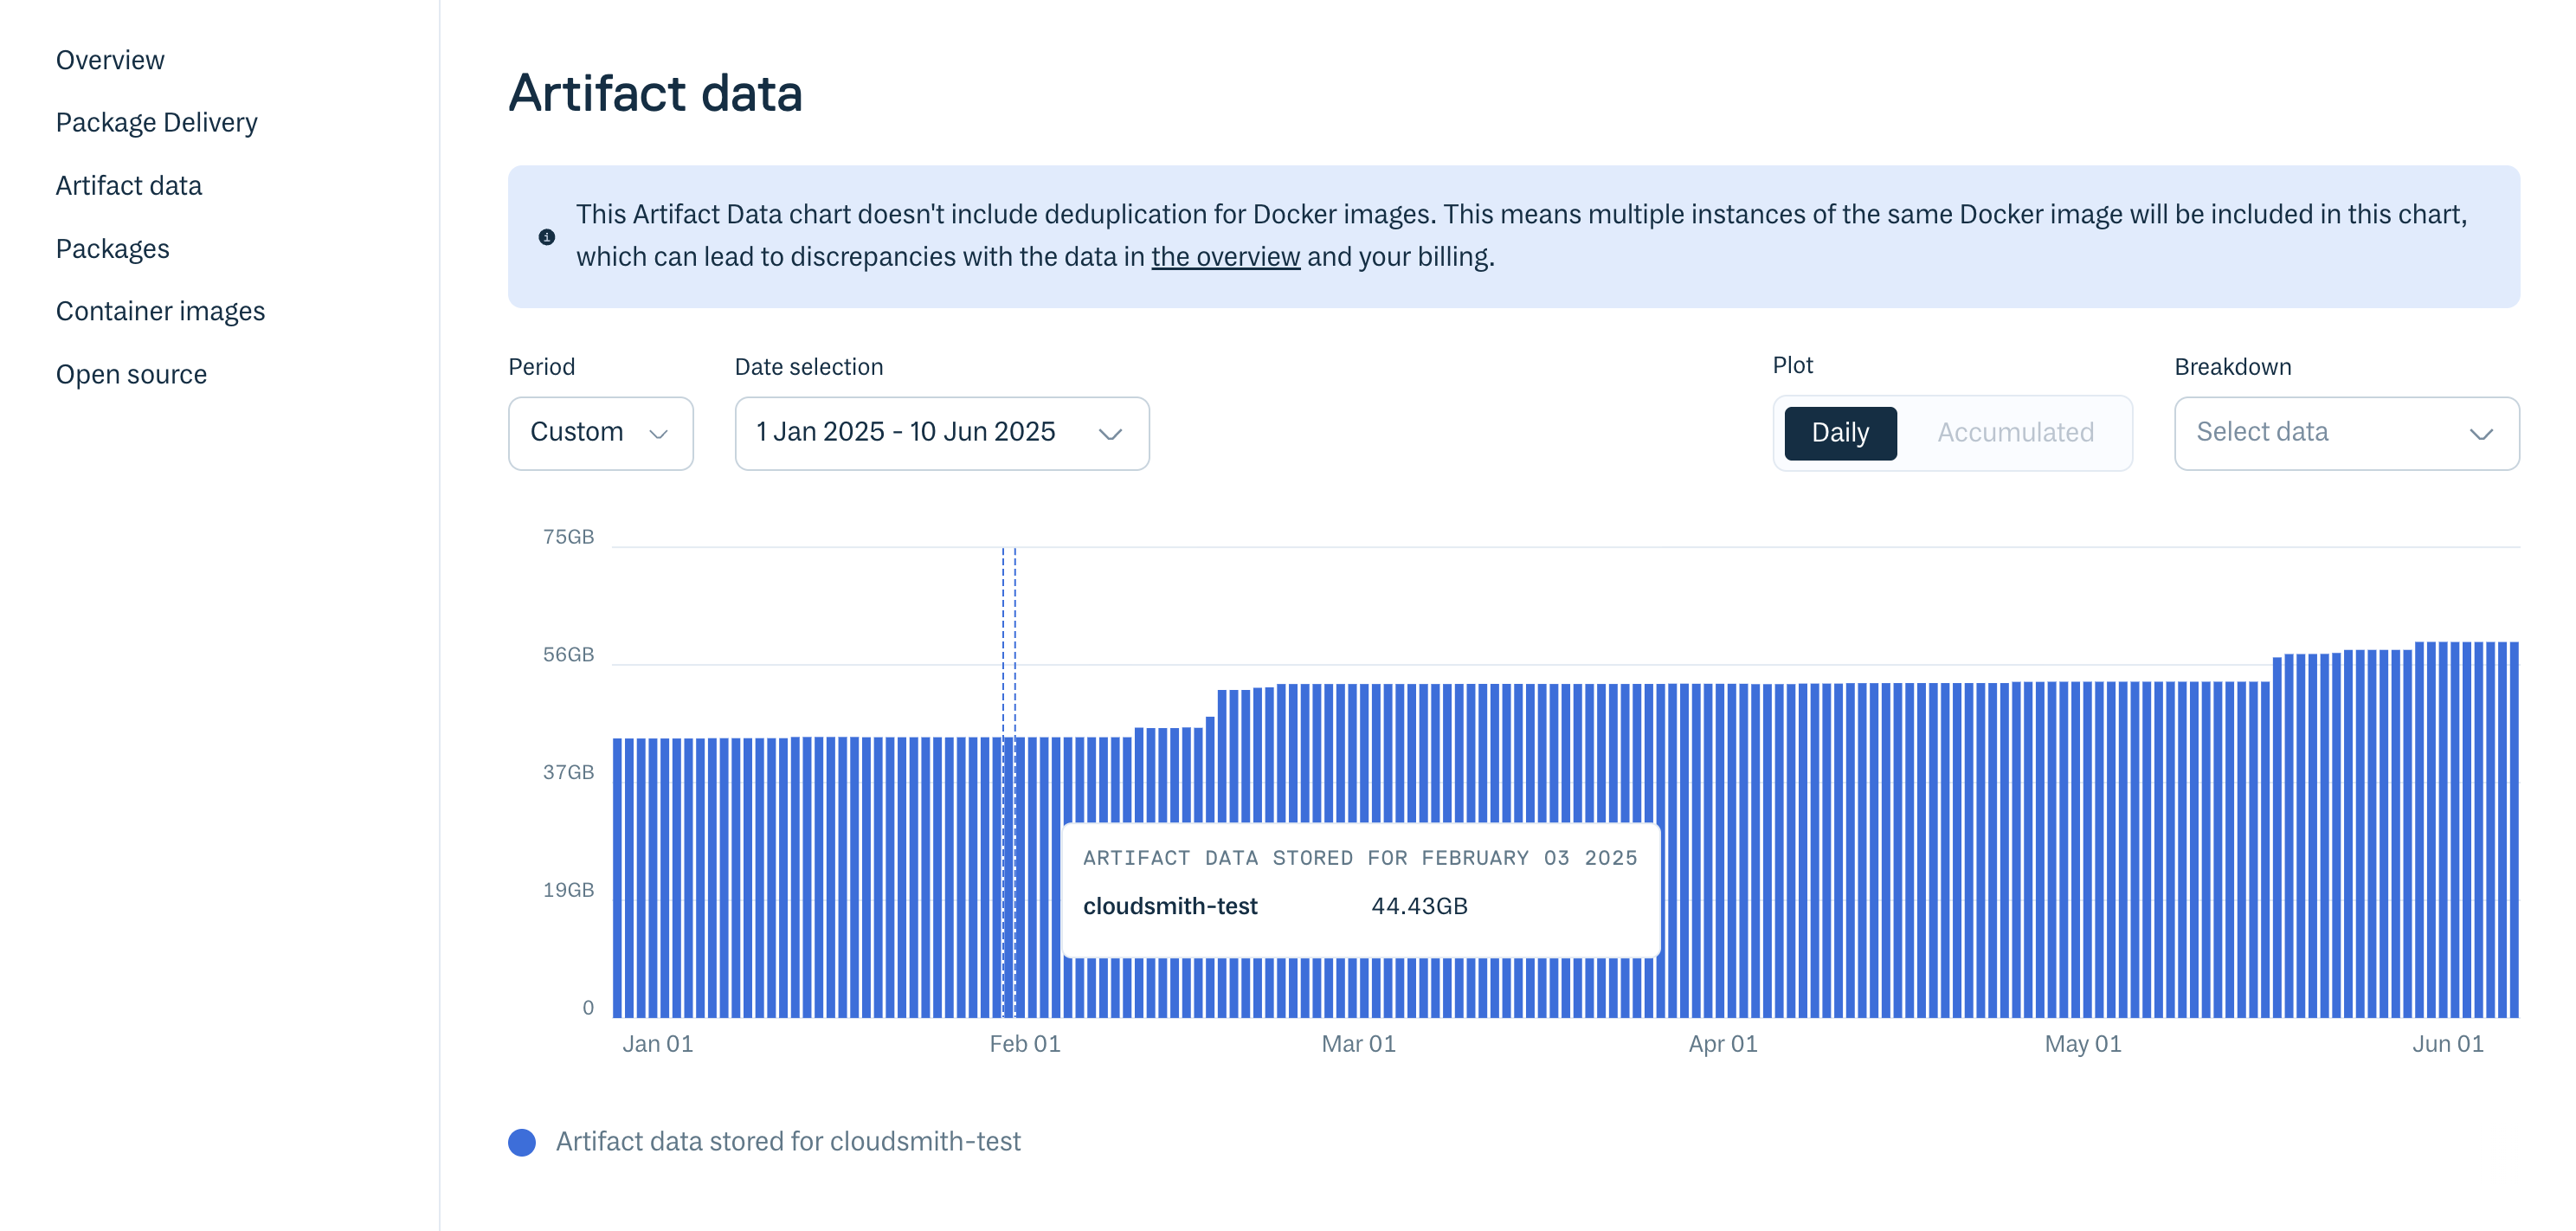
This will increase with time as more artifacts are stored within your Workspace. Retention Rules can help to automate storage management.
Usage via the CLI
You can query the number of active (has been downloaded) and inactive (has not been downloaded) packages via the Cloudsmith CLI with the cloudsmith metrics packages command:
cloudsmith metrics packages OWNER/REPOSITORYExample:
cloudsmith metrics packages demo/examples-repo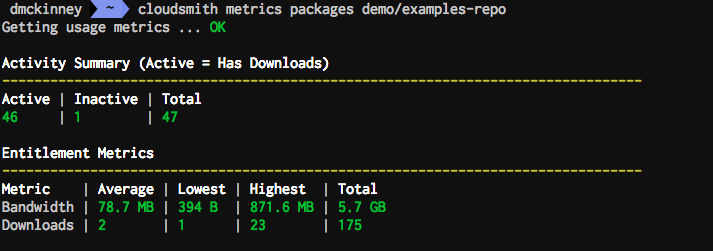
You can also query package activity during a specific time range using the --start and --finish parameters and ISO 8601 formatted datetimes.
Example:
cloudsmith metrics packages demo/examples-repo --start=2019-01-01T00:00:00Z --finish=2019-12-31T00:00:00ZSpecific Packages
You can query one or more specific packages by adding the --packages flag with package identifiers as a comma-separated list (See Package Identification for more information).
Example:
cloudsmith metrics packages demo/examples-repo --packages=ZGCV58VqT8SlUpdated 6 months ago