
Client Logs
Cloudsmith's Client Logs provide a single pane of glass to visualize, filter, and export information about package usage within your entire workspace. It keeps the same artifact-agnostic support to unify information about all of your repositories, packages, and users in one place.
The feature described on this page references the new web appCloudsmith has released a new version of this feature, with enhanced performance and capabilities.
Contact us to enable this feature for your workspace and navigate to Client Logs from the Workspace Overview in the new UI.
DisambiguationIf you want to learn how to review an audit of actions performed by users of your workspace, visit the Audit Logs section.
If you need information about usage to understand its impact in billing, click in the Usage tab in the top right corner of your Workspace.
Use cases
No matter if your goal is gaining visibility, performing an exploratory analysis, or reporting to stakeholders, Client Logs provides all the information that you need. Here you can find a few example use-cases:
- Analyze which Maven artifacts were downloaded last month.
- Understand all the different artifacts used in a staging pipeline.
Requirements
To access Client Logs, you should be a Manager or an Owner of your Workspace.
VisibilityClient Logs displays information about all of the repositories in a Workspace, no matter if they're public or private.
Navigating the Client Logs overview
You can access Client Logs directly from your Workspace Overview page or from any Repository main page.
To access your Client Logs, browse to any of your workspaces and click the Logs tab in the top right corner.
Executing the same action from a Repository Overview page takes you to the Client logs, but automatically adding a filter to include only download events associated with this repo.
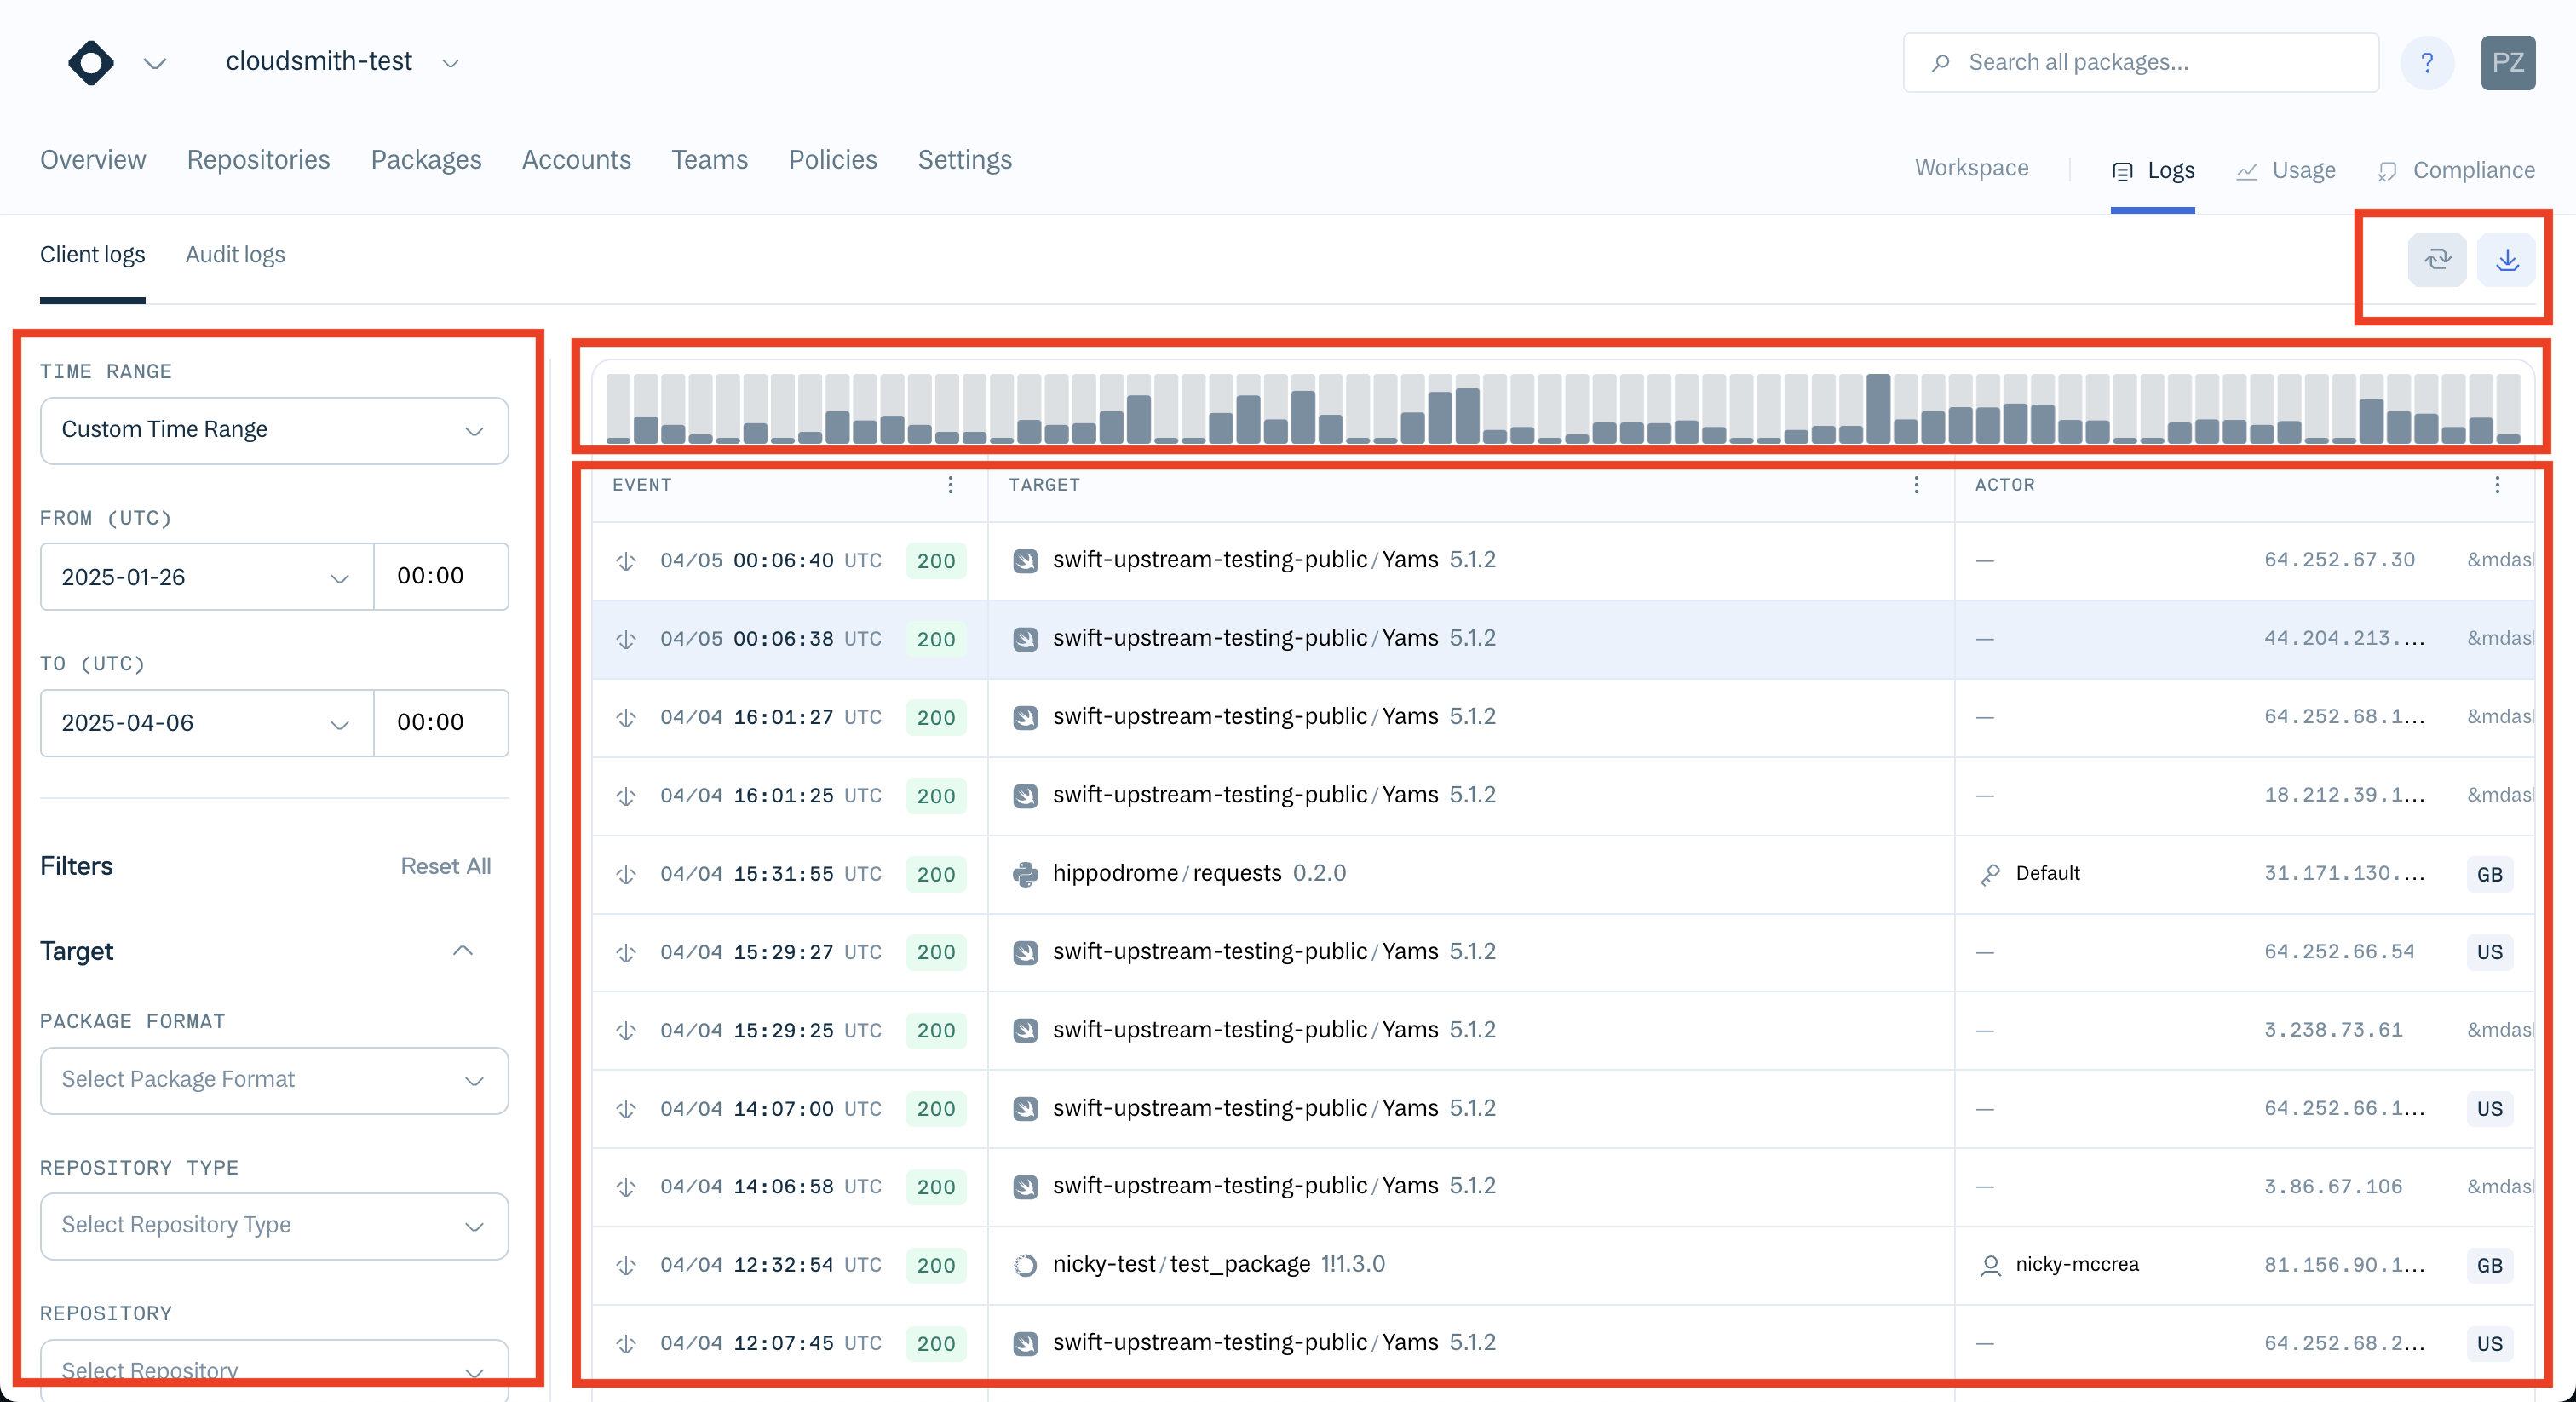
The Client Logs area displays the following information:
| Section | Description |
|---|---|
| Filters | A Filter menu in the left to scope your search by any Target or Actor parameters. Learn more about fields available in Fields and filters. |
| Time-graph | An interactive time-frame graph in the top of the screen to visualize how events distribute across the time-frame selected. Use this visualization to zoom into your data. |
| Events view | A list of events result from applying the filters to the search. Here you can visualize every single package downloaded from your workspace. |
| Actions | Two action buttons in the top right corner to fetch new data or download a report of events with your selected scope. |
Filters
Client Logs allow you to filter events by time or any of the download fields available.
There are two main categories:
- Target: Information about the artifacts or repositories.
- Actor: Identify who's downloading the package.
| Filter | Description | Filter | Description | ||
|---|---|---|---|---|---|
| Target | Actor | ||||
| Package Format | Maven, Python, Docker... you name it. Cloudsmith supports 30 different formats. | IP Address | IP address of the download request | User Type | User or Service. |
| Repository Type | Public, Private, or OSS. | Users | Name, determined by the owner of the API Token used. | ||
| Repository | the name of your repo. | Entitlement Token | Name of the service or non-human agent that downloaded the package. |
Using the time filters
The time graph shows how your package downloads distribute across time.
It helps you to visualize in a quick view when there's more or less demand.
Each block in the graph represents the atomic time interval for the current view, for example one week.
Hover your mouse over each of the block to preview the number of items downloaded in that period.
Use the left menu to select your desired time scope: last 30 minutes, last hour, last day, last year, or a custom time range for more specific periods.
Alternatively, you can use the time graph to browse for a specific time range.
Click and drag your mouse in the graph to zoom in your data. to select the specific period you want to visualize.
This action displays the total number of items downloaded during the specified period.
Then, to apply the selected filter to the list of events, just click Set as time range and the web app returns a new filtered list of results.
Once applied the desired scope, you can preview the list of downloads matching the conditions.
Visualizing events
When you perform a single download, the client may also need to fetch metadata about the package, indexes, and keys.
As a result, a single package download usually results in more than one log.
The number of requests that you see for a single download varies based on the package format.
For each of entries, you have an overview of the next information available:
| Column | Description |
|---|---|
| Event Type | Cache Miss, Hit, etc. |
| Timestamp | The date and time of the request. |
| Status Code | The HTTP status code for the request. |
| Target name | The name of the asset requested |
| Target EULA | If requires acceptance of a End-User License Agreement (EULA). |
| File-size | Size of the asset requested. |
| Latency | Response time. |
| IP Address | The IPv4 or IPv6 address for the request. |
| Authentication | The type of authentication provided, if its a private repositor |
About error logsClient logs only contain successful requests, hence it is not a tool to expose error logs (for example, flagging that final users are fetching wrong packages or repos).
Analyzing a specific entry
Below you can find a preview of one of the event entries.
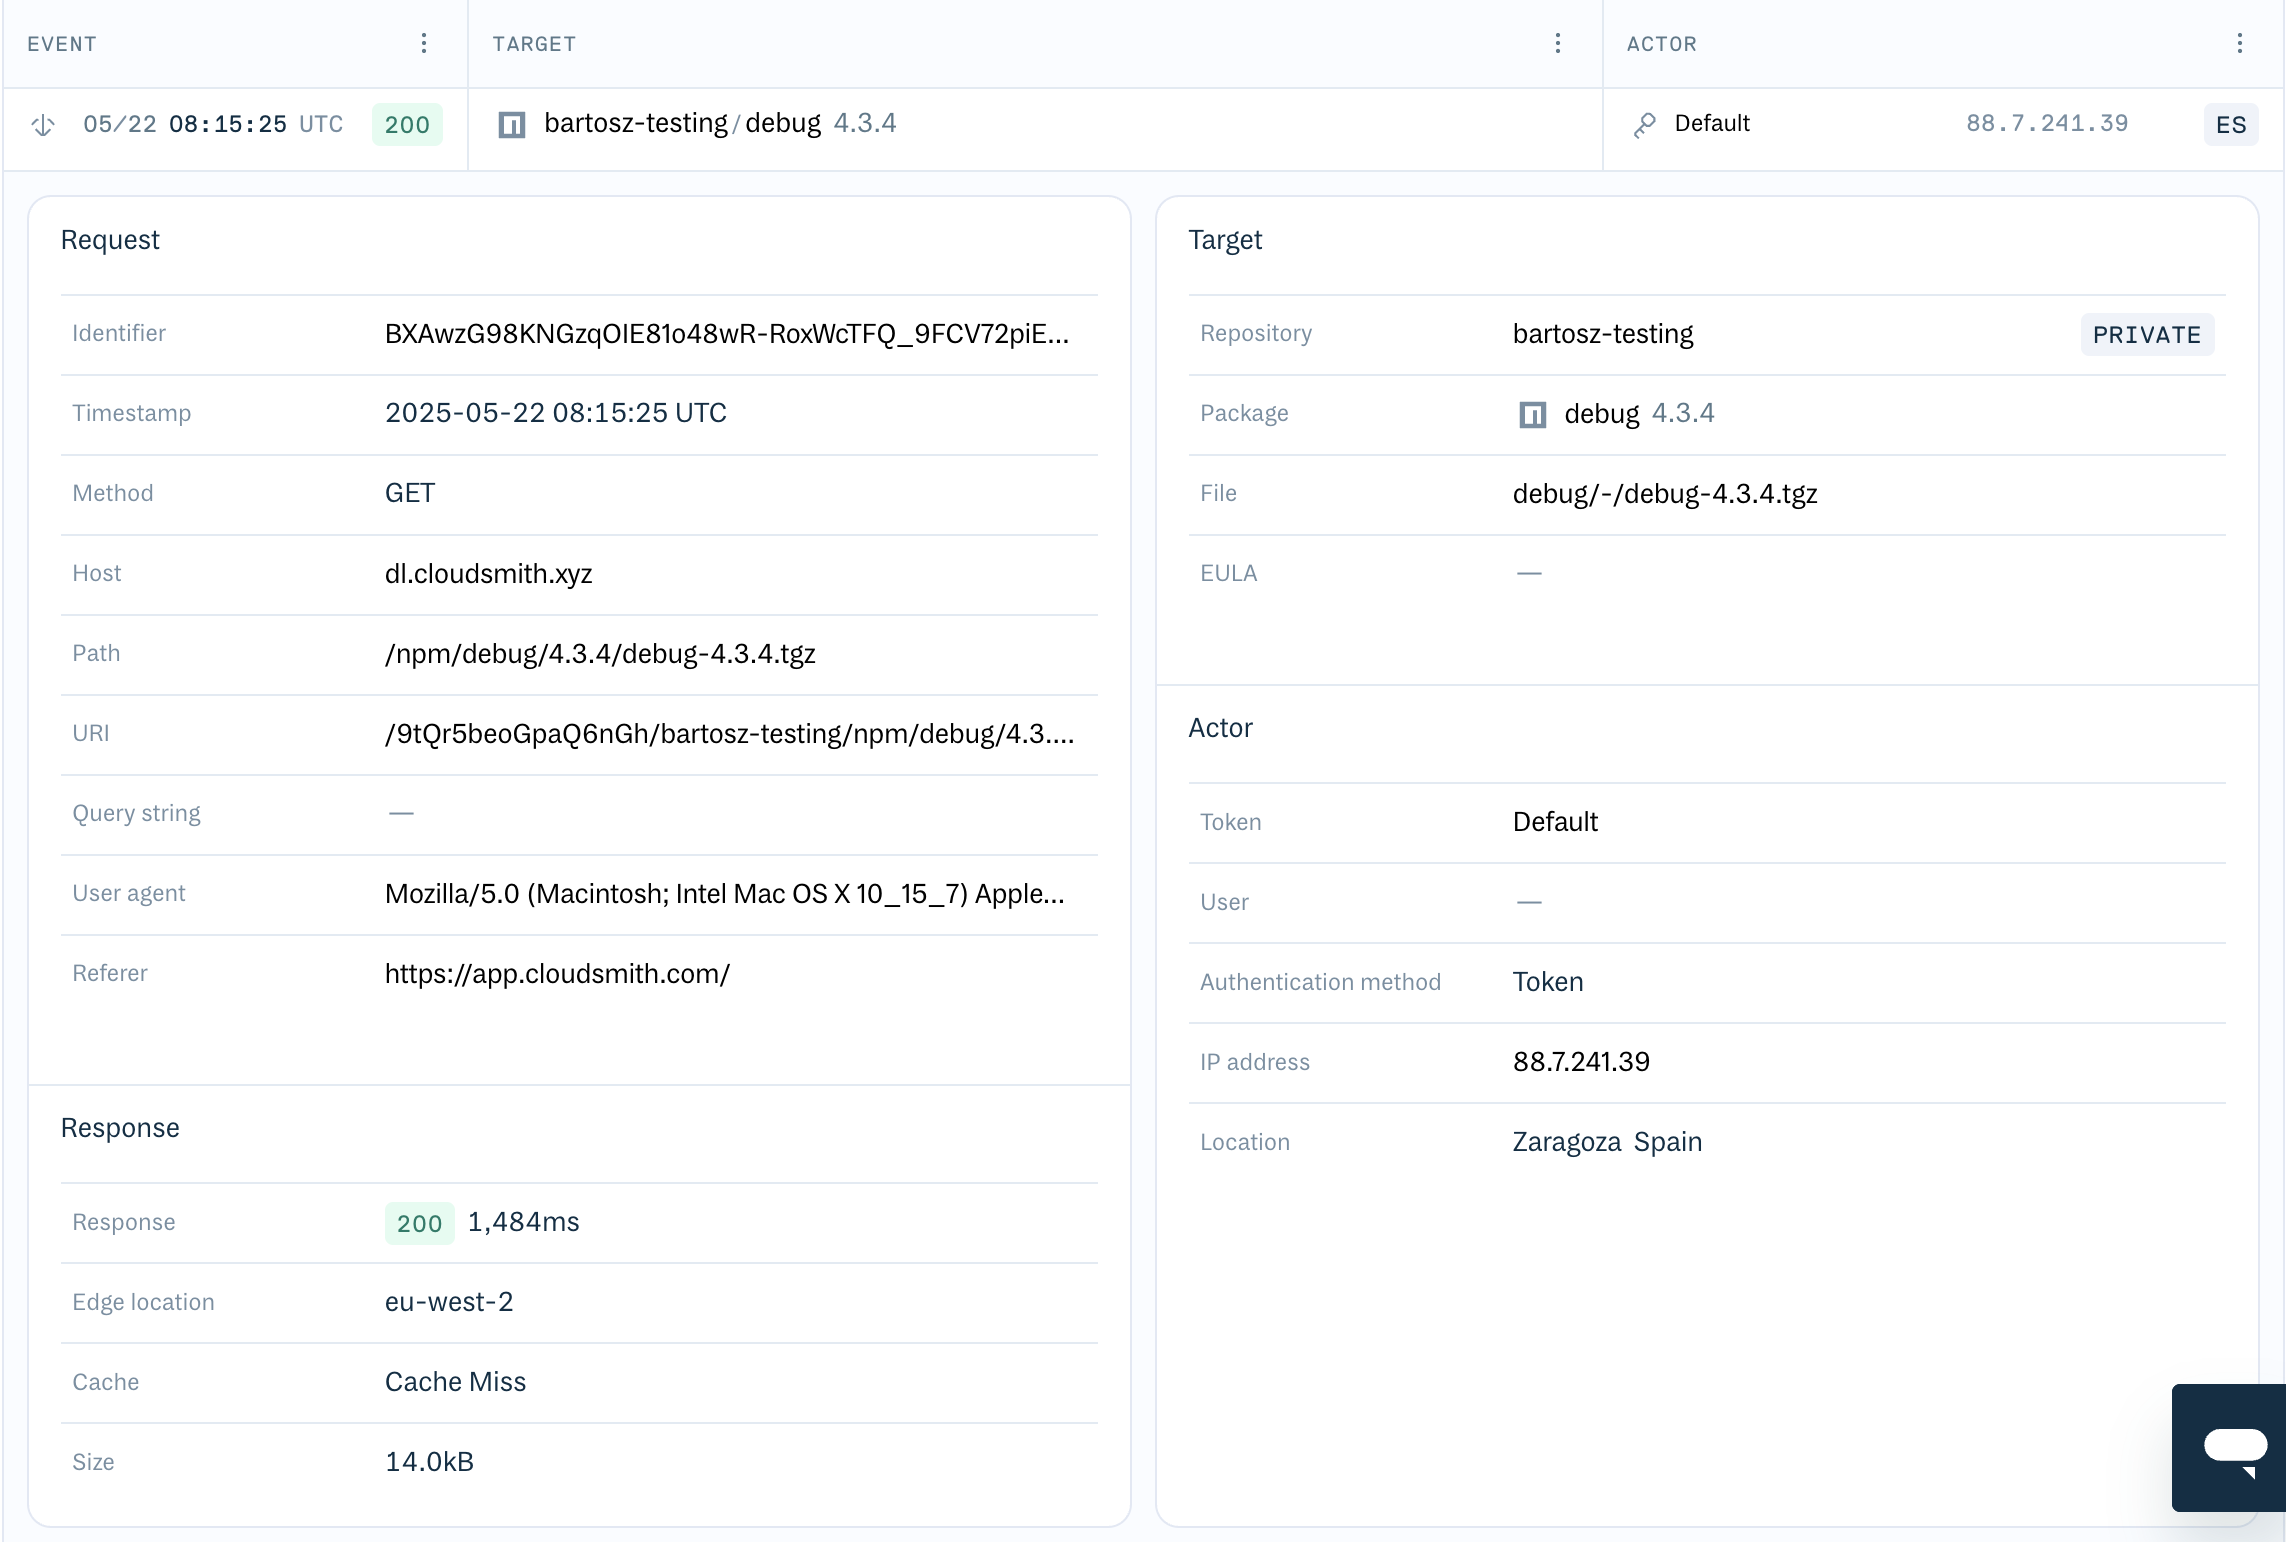
This log entry captures an event where the package bartosz-testing was requested. It is divided into several logical sections: request, response, target, and actor.
Request details
This section describes the specifics of the client's request.
| Field | Example Value | Description |
|---|---|---|
| Identifier | BXAwZg98KnQXZOlE8Io48iWr-RoxWcTFQ_9FCV72pIE... | A unique identifier for this specific request within the system. |
| Timestamp | 2025-05-22 08:15:25 UTC | The precise date and time the server received the request. |
| Method | GET | The HTTP method used for the request (for example: GET for retrieval, POST for submission). |
| Host | dl.cloudsmith.xyz | The hostname or domain to which the request was directed. |
| Path | /npm/debug/4.3.4/debug-4.3.4.tgz | The specific path to the requested resource on the host. |
| URI | /9tQrQ5beoGpaQ6nGh/bartosz-testing/npm/debug/4.3... | The complete Uniform Resource Identifier of the requested resource. |
| Query string | - | Any parameters appended to the url after a ? (empty in this example). |
| User agent | Mozilla/5.0 (Macintosh; Intel Mac OS X 10_15_7) Apple... | A string identifying the client's web browser, operating system, and other details. |
| Referer | https://app.cloudsmith.com/ | The url of the page that referred the client to the requested resource. |
Response details
This section provides information about the server's reply to the request.
| Field | Example Value | Description |
|---|---|---|
| Response | 200 1,484ms | The HTTP status code and the time (in milliseconds) it took for the server to generate and send the response. |
| Edge location | eu-west-2 | The geographical location of the server (edge node) that processed the request (for example: an AWS region). |
| Cache | Cache Miss | Indicates whether the requested item was served from a cache (Cache Hit) or had to be fetched from the origin (Cache Miss). |
| Size | 14.0kB | The size of the response body, typically the size of the downloaded file. |
Target details
This section focuses on the specific package or artifact that was the subject of the request.
| Field | Example Value | Description |
|---|---|---|
| Repository | bartosz-testing | The name of the repository where the package is stored. |
PRIVATE | Indicates the access level of the repository (for example: PRIVATE, PUBLIC). | |
| Package | debug 4.3.4 | The name and version of the requested package. |
| File | debug/-/debug-4.3.4.tgz | The specific file within the package that was accessed. |
| EULA | - | End-User License Agreement information (if applicable). |
Actor details
This section provides information about the entity (user or token) that initiated the event.
| Field | Example Value | Description |
|---|---|---|
| Token | Default | The authentication token used to authorize the request. |
| User | - | The specific user account associated with the token (if applicable). |
| Authentication method | Token | The method of authentication used for the request. |
| IP Address | 88.7.241.39 | The public IP address of the actor. |
| Location | Zaragoza Spain | The geographical location (city and country) derived from the actor's IP address. |
Download Logs for DockerDue to the nature of Docker and how layers may be shared across images, download counts for Docker are collected differently from other formats. The download count displayed for a Docker package is based on pulls of the "configuration" layer for an image, so pulls for other data-based layers aren't counted. However, this is typically enough to gauge usage for an image.
Reporting
Once you have found what you were looking for, click in the top right corner download button and then confirm the Download to get a report of all the download actions in CSV format.
FAQs and troubleshooting
Why is the downloaded package name not populated?
There are two possible reasons:
- There wasn't a package download, it was a metadata file download.
- Deleted package since upload.
Why is a repository/user/token field not populated?
Logs only contain anonymous identifiers for certain objects like packages, users, or repositories. So, if the field is empty, it's likely the repository/user/token has been deleted since the download occurred.
Updated about 1 month ago